EGEO 450 - Intermediate GIS (Fall 2008)
Lab 3 - Advanced Cartography Thematic Map
For this project, I immediately decided to do something related to Bellingham, so I would encounter as few problems as possible in terms of availability of information issues (which I have had trouble with in the past, and I have now learned from those mistakes!). I created a hillshade using the Swiss Hillshade method we learned in class. Choosing a color ramp was one of the most time-consuming processes of this project because it seemed to make such a difference in the visual quality of the map, so I spent quite a bit of time and effort choosing the right colors. I settled on a four-section ramp, ranging from brown for the highest elevations, to green for the lowest, which I thought best captured the changes in elevation for this area. If you looked at a google satellite map of this area, however it would be all green. I thought this was too much of the same color, and did not adequately clarify the elevations.
Next, I chose the Bellingham Bay and Lake Whatcom Bathymetry layers, with blue color ramps, and a 50% transparency. I also attempted to do a linear gradient fill to make “glints” on the water, but did not notice a difference once they were incorporated.
Now that my hillshades and bathymetry layers were done, I tried to decide what information I wanted to convey with this project. The first thing I was trying to do was to find a way to incorporate my anthropological/archaeological/historic background. After browsing around the database, and viewing many attribute tables, I decided on the parcel layer, from which I could get construction dates for homes around the city. I chose the homes that were built on or before 1885 using select by attribute, then clipped those so the only ones that were on my map were those within Bellingham city limits. This left me with seven homes. Since the attribute table did not provide street or address information, I took the parcel number from the attribute table, entered each house in the Whatcom County Real Property Database, and noted the address for each home. I took pictures of each home with the intent of adding them to the paper map, but it looked too busy with all the photos, so I added them to my website instead, where they can be viewed online with the web version of this map.
For some final touches, I added the neighborhood layer to delineate the City of Bellingham, and chose a 50% transparency so it was more subtle. I also added a streets layer, since I was mapping the homes, and clipped that to the neighborhood layer.
For the layout portion, I focused on a historic look for the map, with Harrington fonts, and earthy colors.
Overall, I am pleased with how the map turned out. The trickiest part was getting all the information across that I thought was important without making the map too visually distracting. On a personal note, seeing those old homes and how different they all look now, depending on how they were maintained was really fascinating.

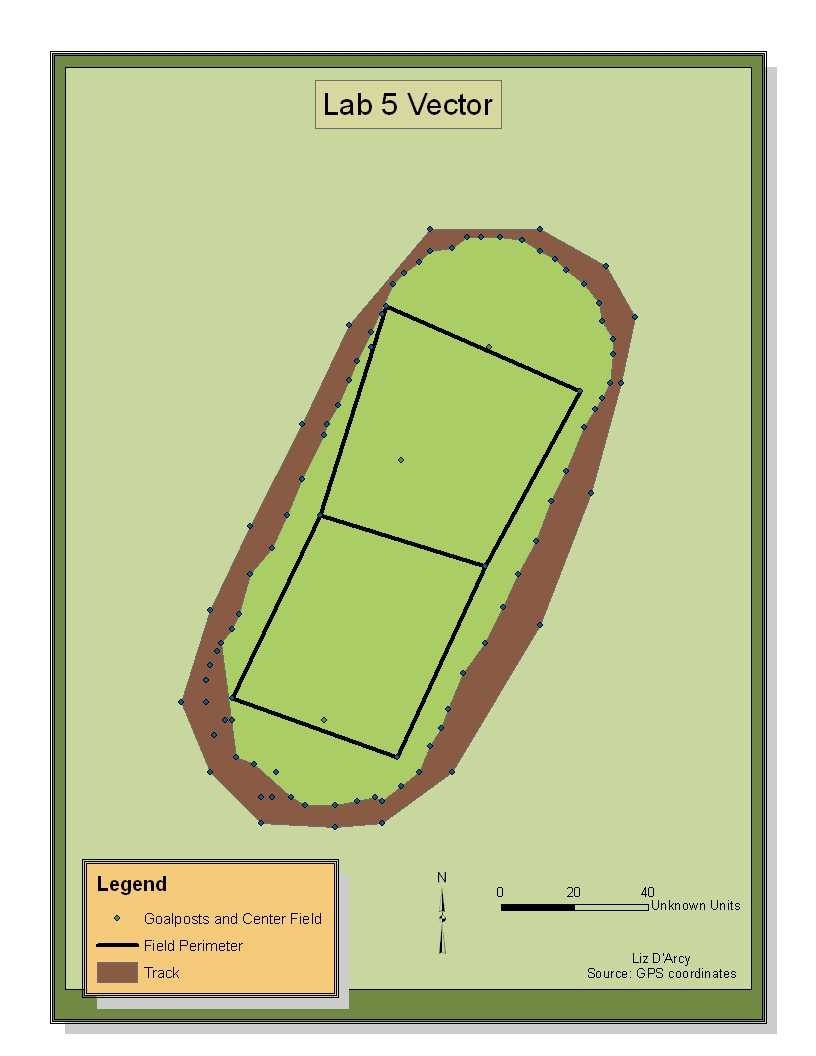
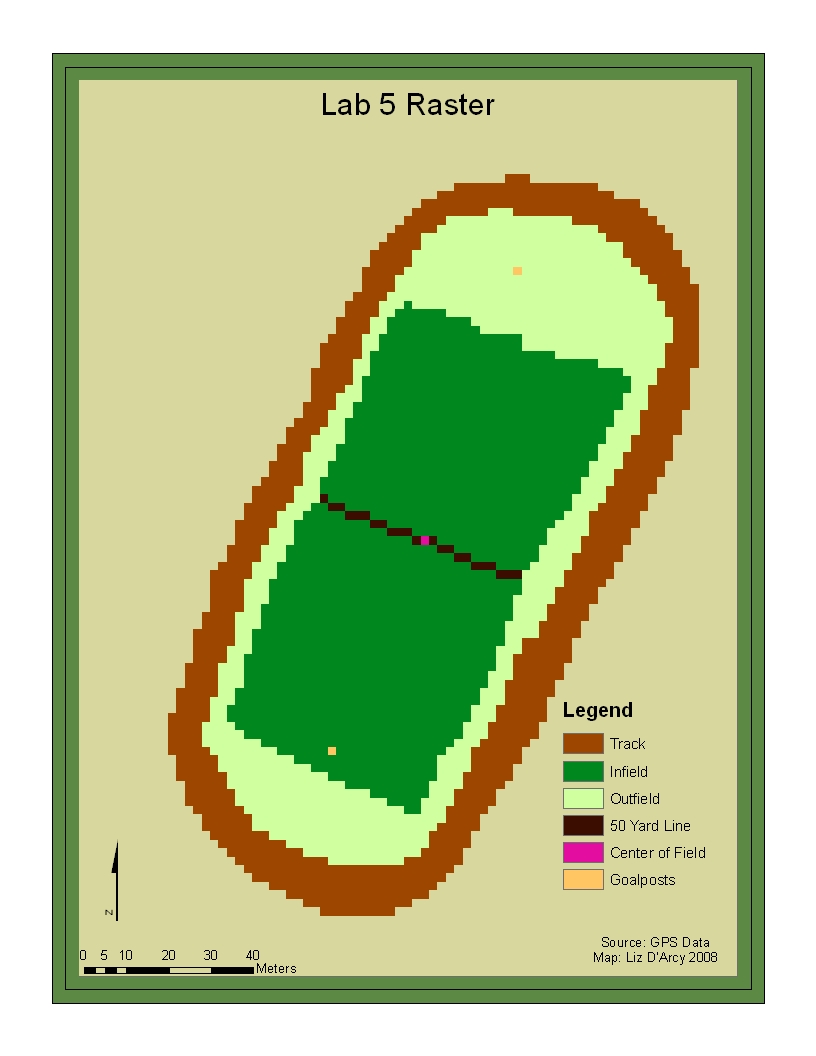
Lab 5 - Football Field GPS Data
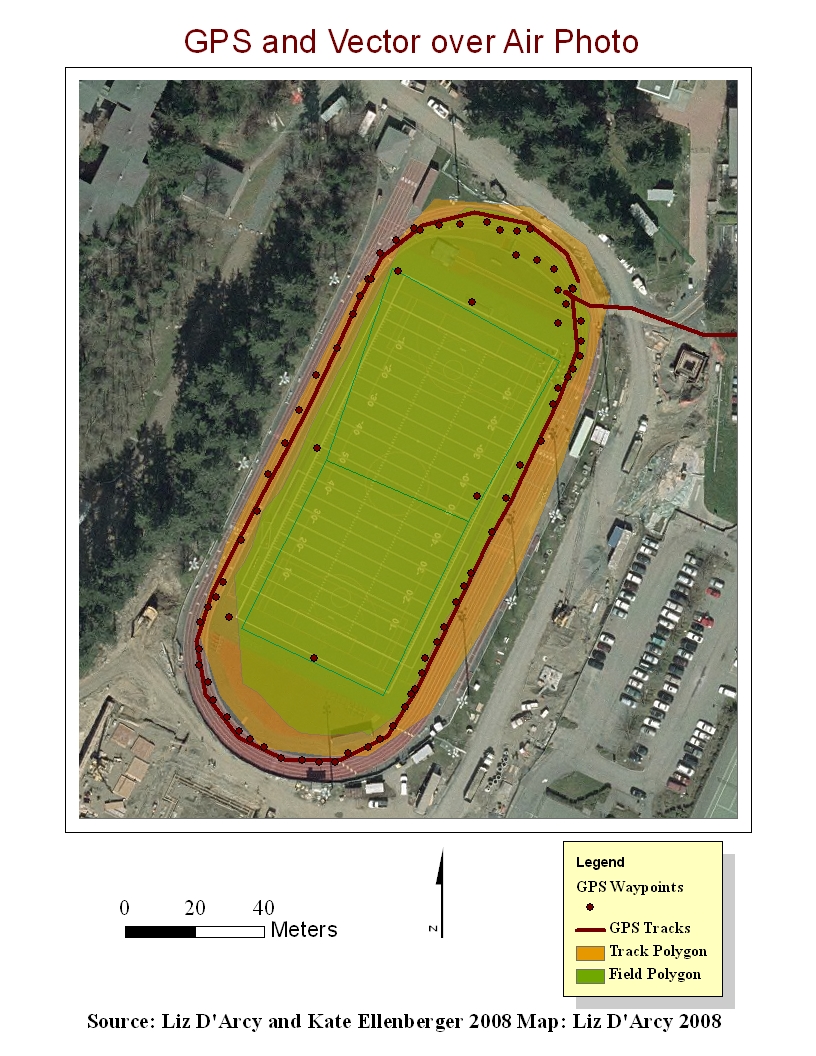
For this lab, a classmate and I worked together on manual data collection in the field. In an attempt to obtain more accurate results, we collected points every 5 - 10 meters around the inside edge of the track, all four corners of the field, the goalposts, and the ends of the fifty yard line. We also collected waypoints (the GPS unit collected data automatically every few seconds while we walked around the outer edge of the track at a moderate pace).
When we returned to the lab, we downloaded our GPS data as shapefiles. Even though we had collected a lot of points, our field and track points varied greatly compared to the oblong shape we had been hoping for. This is a testament to the inaccuracies that can be inherent in this type of data, and that satellite data is vulnerable to many types of interference that can easily throw off results.
I then used graph paper to create board coordinates for the data, essentially connecting the dots to redraw the data by hand.
Following Stephan's instructions, I :
For the map, I went with colors that seemed to represent the actual colors of the features we were mapping - brown for the track, greens for the grass, etc.
When we returned to the lab, we downloaded our GPS data as shapefiles. Even though we had collected a lot of points, our field and track points varied greatly compared to the oblong shape we had been hoping for. This is a testament to the inaccuracies that can be inherent in this type of data, and that satellite data is vulnerable to many types of interference that can easily throw off results.
I then used graph paper to create board coordinates for the data, essentially connecting the dots to redraw the data by hand.
Following Stephan's instructions, I :
- created an XY event table by entering the newly created board coordinates into an excel file, which was subsequently converted to a .txt file, added the XY data to ArcMap and created an Event Layer, and exported that Event Layer into a Shapefile.
- Created generate files for the point, line, and polygon features. These were then used to create and build coverages.
- Created a geodatabase to manage all the files, with the feature dataset named "Raw_Data".
- Converted the coverages to Feature Classes, and added them to the Geodatabase.
- The above XY Event Layer was also converted into a Feature Class.
- Imported the XY Event Table into the Geodatabase.
For the map, I went with colors that seemed to represent the actual colors of the features we were mapping - brown for the track, greens for the grass, etc.
|
|
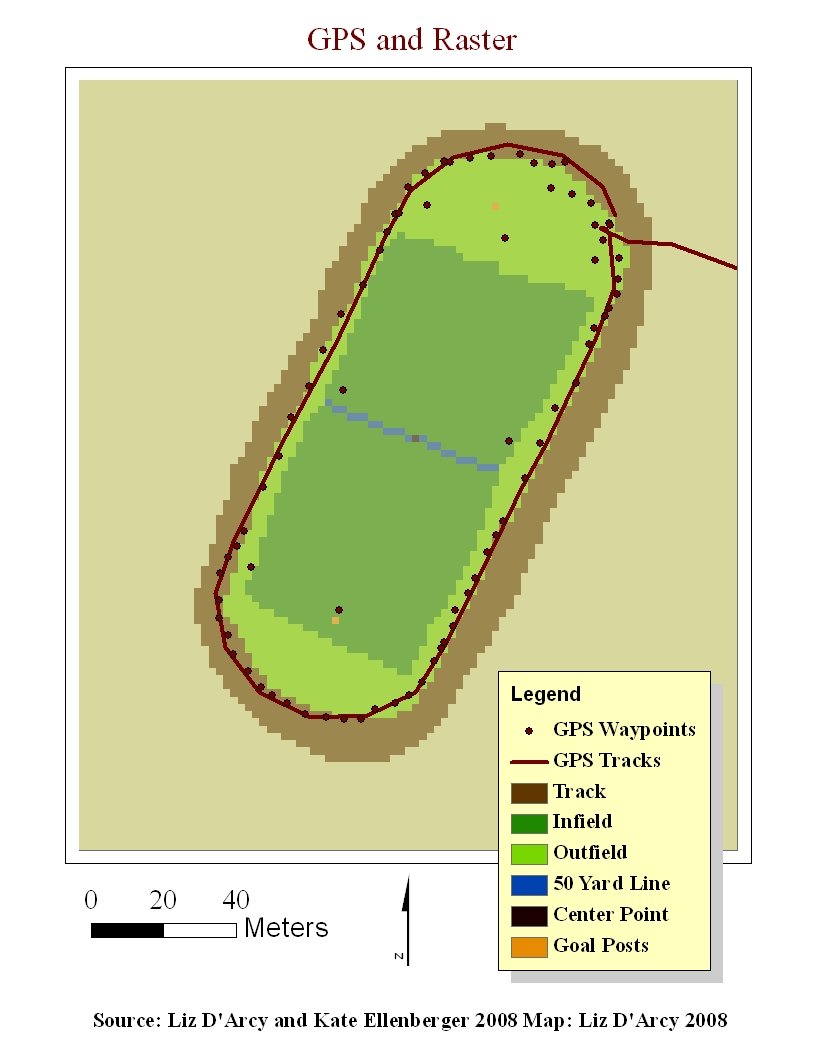
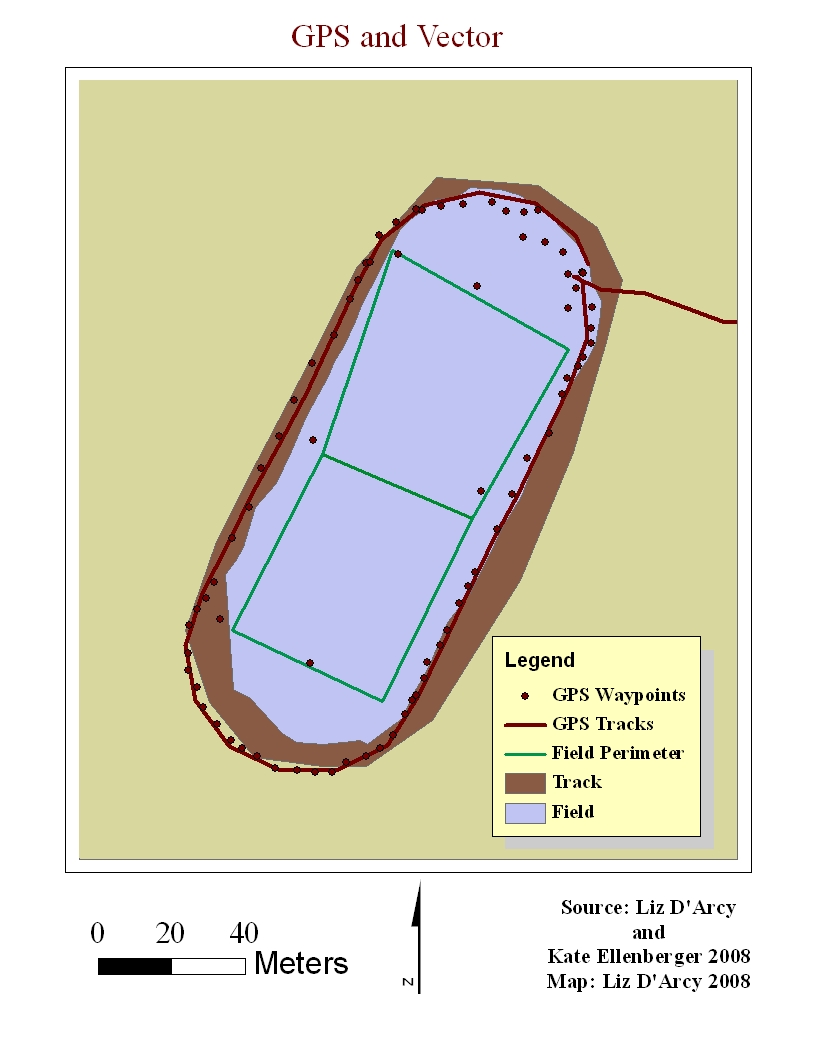
Lab 6 - Using GPS Data in ArcGIS
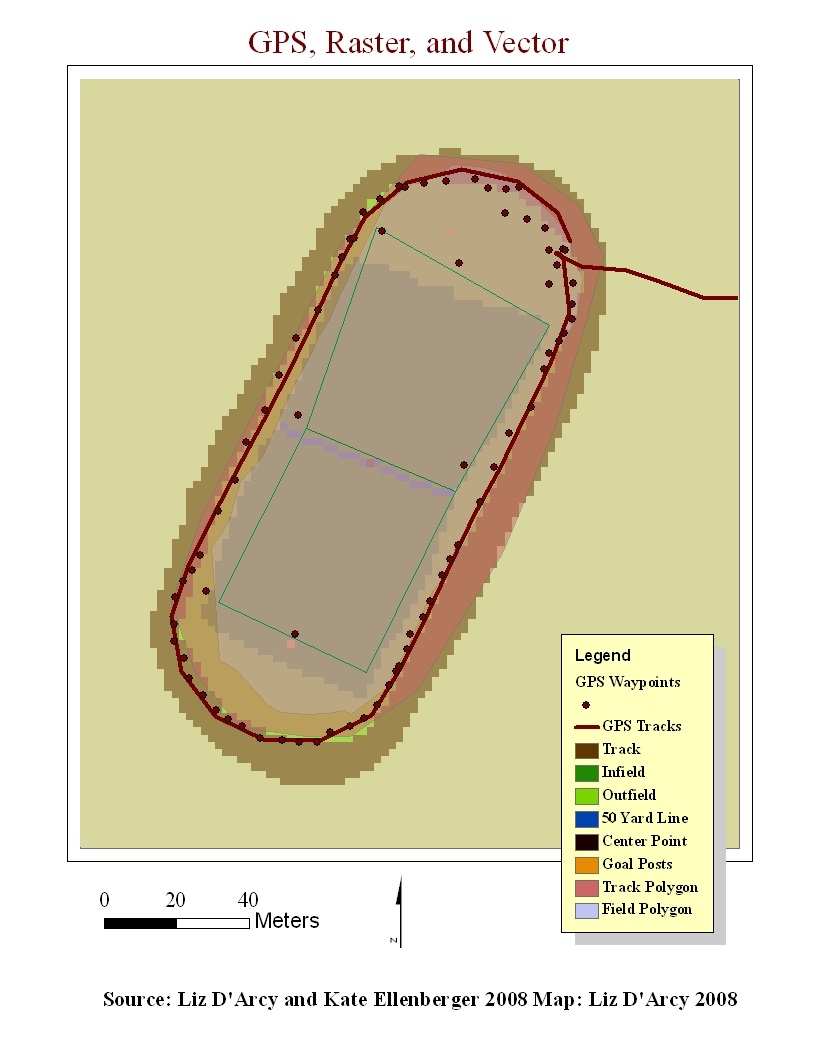
I think the discrepancies between the datasets and their alignment is due to a combination of human error and inaccurate data.
My own errors occurred when attempting to align the rater data with the air photo. I had entered the coordinates wrong, and the raster had no coordinate system (not sure why, as I did this step, but must have missed something). After several (11!) attempts to re-align the two maps, I was successful, and as close as I thought I could get to a good match. Also, when doing the spatial adjustment, I could not get a RSM lower than 3.5.
The inaccurate data created discrepancies because I could not get the spatial adjustment to work well, since the GPS data was so far off to begin with. The vector data seemed to be more accurate, with the exception of one goalpost. The raster data looked really messy, but this could easily be my own data entry error.
|
|
|
|
Lab 7 - Importing Data & Geoprocessing
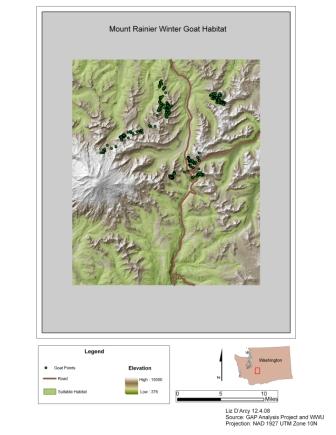
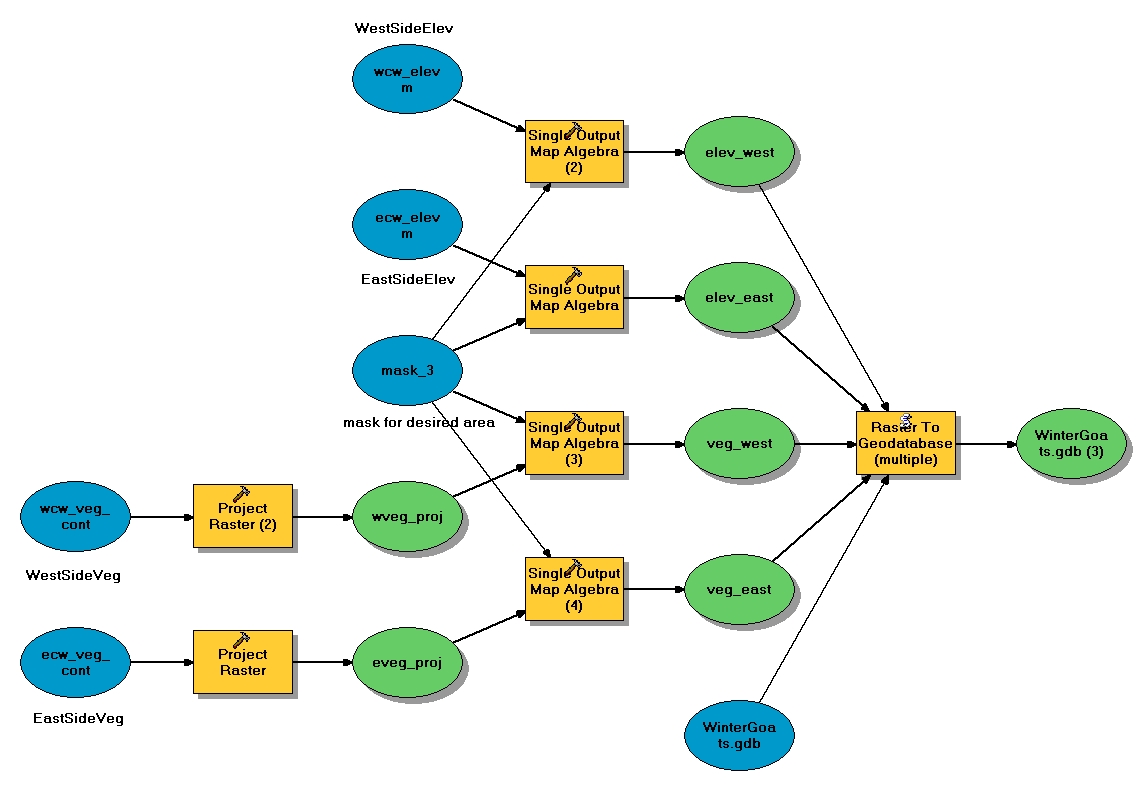
DiscussionThis lab was an exercise to more precisely define winter ( December, January, February, and March) habitat ranges of Cascade mountain goats (Oreamnos americanus). My focus was on the White River/Sunrise areas of Mount Rainier National Park.
Method
First, I created a mask that encompassed my study area. All layers were subsequently clipped to this mask.
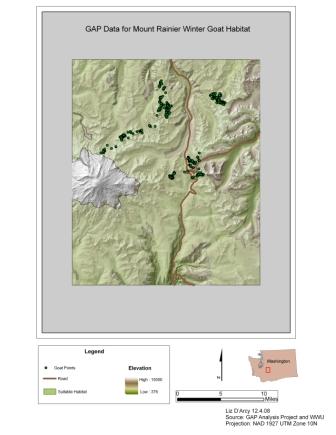
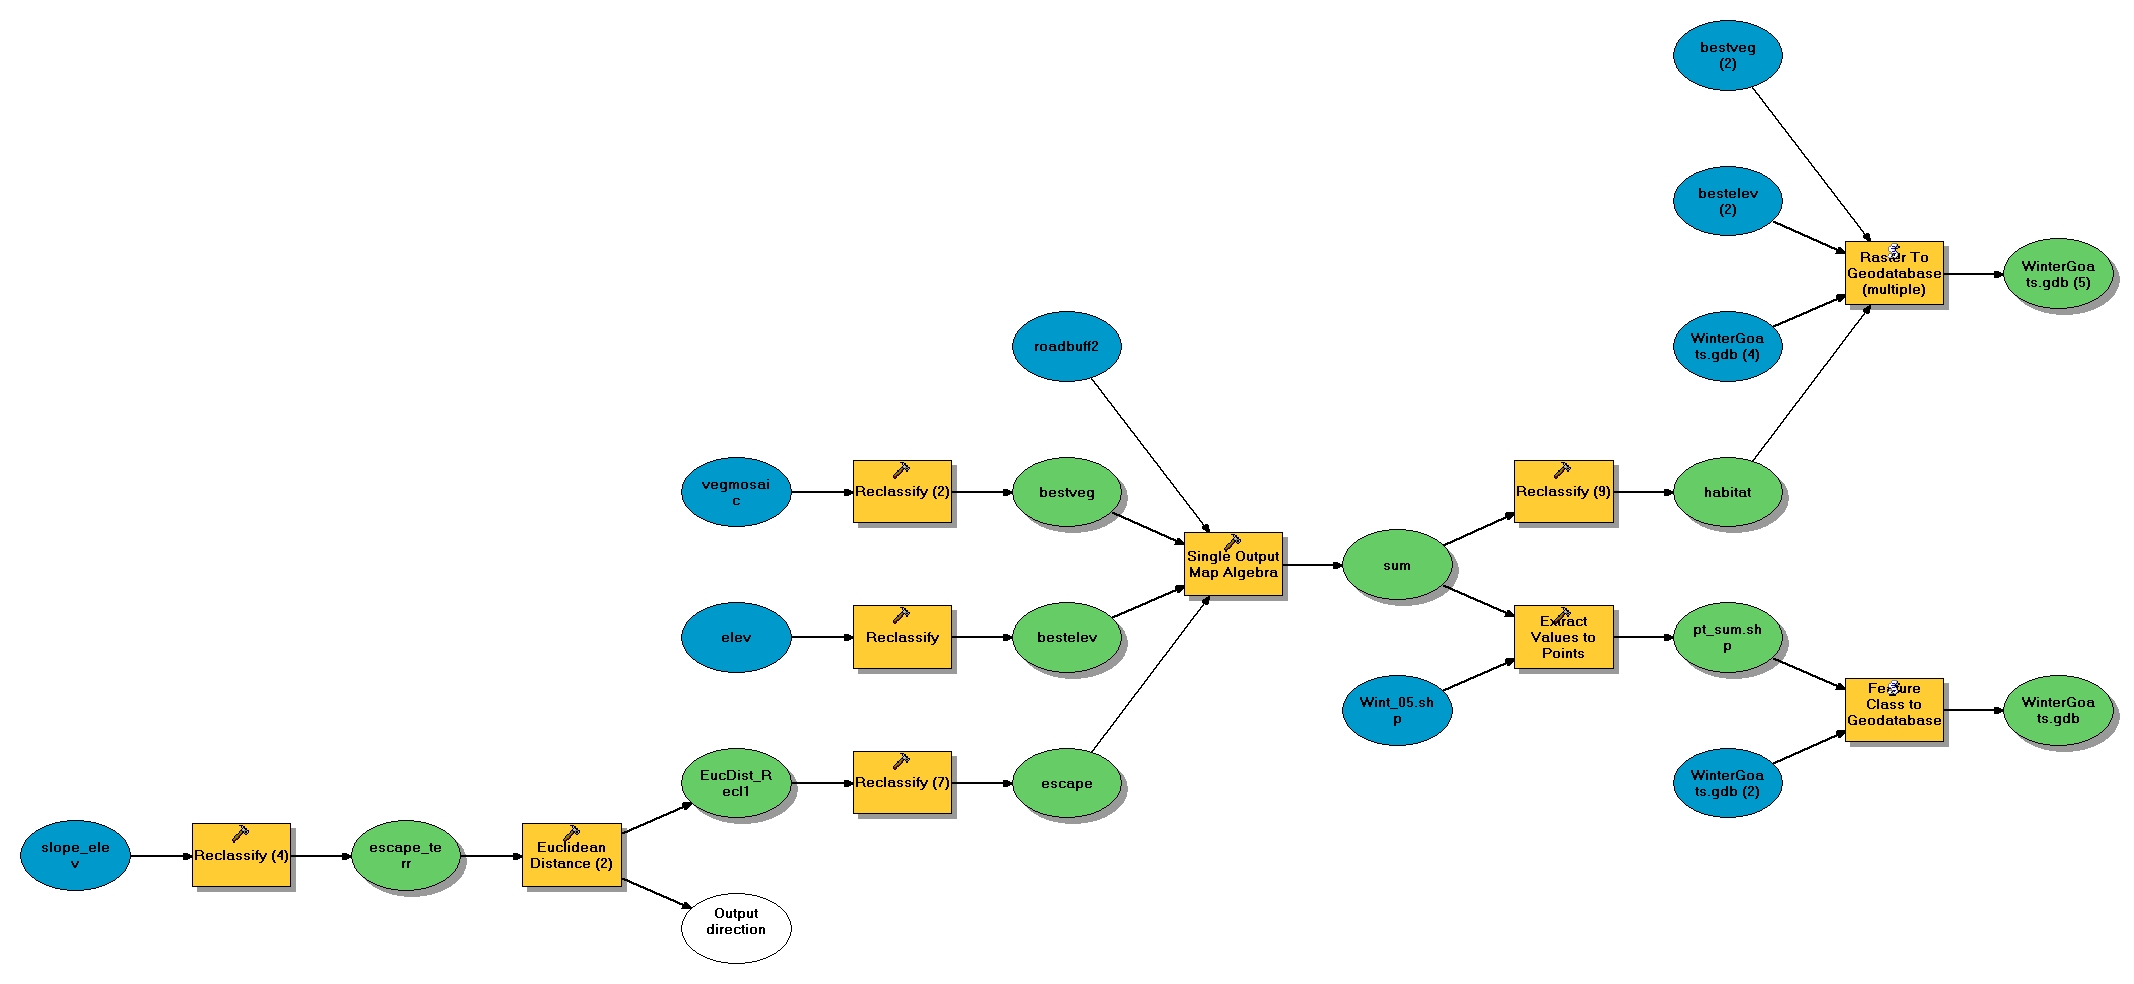
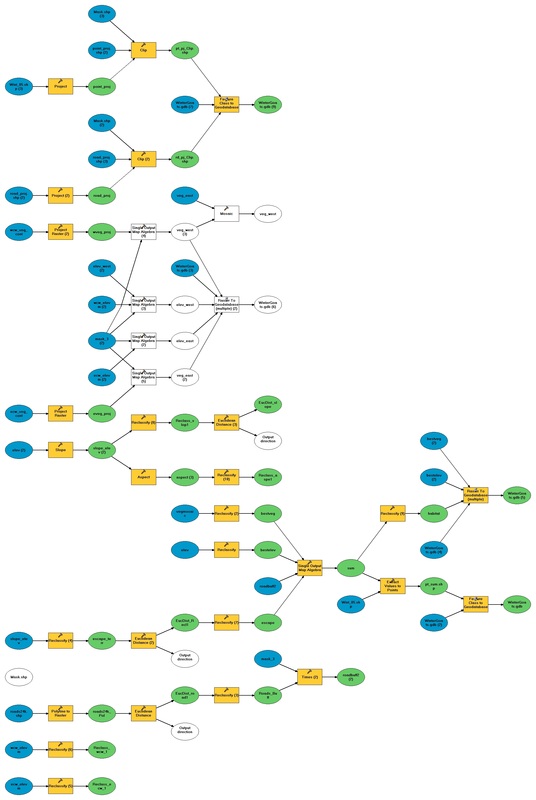
Using model builder, I narrowed down suitable habitat areas by determining the best vegetation, best elevation, best aspect, best escape terrain, and distance from roads. I then created maps with the underlying habitat areas and point data from GPS collars on the goats. I then compared the predicted suitable habitat area with WDFW GAP Analysis data (older, less refined data).
Results
My predicted range of winter habitat was 138, 579 acres. However, only 50 goat points out of over 10,000 (0.005%) were located within this range. Obviously, my range was too narrow, and given unlimited time, I could have adjusted the parameters of the habitat infinitely to come up with a more moderate range than the one I developed. I believe my main error was too narrow an elevation range, as it seems that most of the goats were hanging out at elevations much higher than the ones I predicted. The goats were also much closer to the road than the 500m I had buffered for them. Changing these two factors, I think, would have increased my predicted range just enough to encompass a more realistic number of goats without going to the other extreme – like the GAP data.
The GAP data, on the other hand, accounted for the range of 100% of my goats, which is not surprising, considering the suitable habitat area was 6,502,542 acres, a range almost 47 times as large as my predicted range.Their predicted range covered almost every portion of my study area, with the exception of the most extreme elevations. The GAP data went as far as including most of the road as suitable mountain goat habitat. Admittedly (according to their own website), the GAP data is "a coarse-filter approach", and meant to "provide an overview of the distribution and conservation status of several components of biodiversity, with particular emphasis on vegetation and terrestrial vertebrates" (WDFW 2008).
Conclusions
It is clear that protecting goats (and other animals) and creating conservation areas for that purpose is imperative, but we need to be cautious about how we define their habitat areas. Creating a predicted range that is too broad (like the GAP data) can negatively affect human enjoyment of natural resources. In addition, a range that is too narrow (like mine) can leave them unprotected, a situation that could negatively affect the animal and put them in jeopardy of becoming endangered.
References
WDFW 2008 wdfw.wa.gov. Accessed electronically 12.3.08.
Method
First, I created a mask that encompassed my study area. All layers were subsequently clipped to this mask.
Using model builder, I narrowed down suitable habitat areas by determining the best vegetation, best elevation, best aspect, best escape terrain, and distance from roads. I then created maps with the underlying habitat areas and point data from GPS collars on the goats. I then compared the predicted suitable habitat area with WDFW GAP Analysis data (older, less refined data).
Results
My predicted range of winter habitat was 138, 579 acres. However, only 50 goat points out of over 10,000 (0.005%) were located within this range. Obviously, my range was too narrow, and given unlimited time, I could have adjusted the parameters of the habitat infinitely to come up with a more moderate range than the one I developed. I believe my main error was too narrow an elevation range, as it seems that most of the goats were hanging out at elevations much higher than the ones I predicted. The goats were also much closer to the road than the 500m I had buffered for them. Changing these two factors, I think, would have increased my predicted range just enough to encompass a more realistic number of goats without going to the other extreme – like the GAP data.
The GAP data, on the other hand, accounted for the range of 100% of my goats, which is not surprising, considering the suitable habitat area was 6,502,542 acres, a range almost 47 times as large as my predicted range.Their predicted range covered almost every portion of my study area, with the exception of the most extreme elevations. The GAP data went as far as including most of the road as suitable mountain goat habitat. Admittedly (according to their own website), the GAP data is "a coarse-filter approach", and meant to "provide an overview of the distribution and conservation status of several components of biodiversity, with particular emphasis on vegetation and terrestrial vertebrates" (WDFW 2008).
Conclusions
It is clear that protecting goats (and other animals) and creating conservation areas for that purpose is imperative, but we need to be cautious about how we define their habitat areas. Creating a predicted range that is too broad (like the GAP data) can negatively affect human enjoyment of natural resources. In addition, a range that is too narrow (like mine) can leave them unprotected, a situation that could negatively affect the animal and put them in jeopardy of becoming endangered.
References
WDFW 2008 wdfw.wa.gov. Accessed electronically 12.3.08.
MAPS
|
|

DFDs
Preliminary DFD
|
Habitat DFD
|
Application - Archaeological Site Modeling with ArcGIS
“The use of GIS to integrate excavation recording procedures, data management, digital object representation, and spatial analysis, ideally could lead to the formation of a complete digital workflow for archaeological documentation.” (Katsianis et al. 2007)
People have utilized maps for hundreds of years, but in the last few decades, and with advances in computer technology, a map revolution has taken place. Map digitization has facilitated map modification, making time-consuming re-creation of maps after every alteration in data unnecessary. This computerization evolved into Geographic Information Systems (GIS), used since the 1960s for applications ranging from municipal, political, ecological, and management purposes. GIS has found its niche in the archaeological realm only during the last two decades.
According to ESRI (2008), a GIS is a system of hardware and software that can manage, store, analyze, manipulate, and display large volumes of geographically referenced (spatial) data. A GIS can assist the user byanswering questions, testing predictions, and examining relationships in the data. A GIS is most commonly associated with map data, but a GIS can also provide problem-solving capabilities through databases and models. A map shows features in relation to the earth’s surface, and supports query, analysis, and editing of information within the database. A model is the set of geo-processing tools that derives new information from existing datasets by applying analytic functions and rewriting those results onto new datasets. Maps and models rely on the database, and a GIS is unique in that it presents a geographic database (a geo-database). This database describes the world in geographic terms. Together, the map, model, and database views provide far more problem-solving capabilities than simple mapping software or traditional database management systems such as CAD.
In the past, natural resource data has been the mainstay of GIS databases, while cultural resource management has focused on custom, piece-meal databases, or mapping a few GPS points to locate sites in a regional context (Katsianis et al. 2007). Additionally, the need to handle 3D spatial analysis and rendering temporal components into digital formats has slowed the integration of GIS into archaeological applications. Even with the limitations inherent in current GIS programs, computer modeling of archaeological sites can provide unique opportunities for interpretation and analysis.
Moyes and Awe (2000) state that GIS has improved the ease with which archaeologists can analyze depositional patterns of artifact placement, provenience, catalog and record artifacts, and has also provided us with a descriptive and analytical tool that can identify spatial patterns and assist with analysis on the regional level as well as inter-site comparison. Patterns in distribution can offer insight into the ways in which people used space, and in turn how its occupants utilize the site.
According to Ebert (2004), archaeology is inherently a spatial discipline, making GIS a great tool for use in analyzing human behavior and material culture using raster and vector datasets to create multiple layers, conduct spatial analysis, and generate 3D models. Vector (point, line, and polygon) data, can include site features such as unit boundaries and artifact locations, while raster (cell/continuous) data includes aerial photos and scanned documents (Tennant and Bristow 2004:208). A GIS can analyze features to determine volumes, size, diameter, or perimeter, and can analyze spatial relationships or distributions (Neubauer 2004).
A good model for how to use GPS and GIS on the site-level comes from Tennant and Bristow (2004). They set aside five days to map visible features at their site (Nenthorn) with a GPS unit. The group used a Trimble GeoExplorer CE XT because of its sub-meter accuracy. The authors stress the importance of pre-planning at this stage to get the best results from field time. Knowing where the features are located by referencing previous surveys and excavations was important. It is also imperative to use the almanac file to check satellite locations, to determine the best times for collecting GPS measurements with the highest accuracy and precision.
The team recorded each feature by placing the GPS antenna over each feature they wished to record, taking multiple measurements to be averaged later. Those points and measurements were stored within the GPS unit, and corrected in the lab for increased accuracy. The team then converted those files into an ArcMap-friendly format that they would use later within ArcGIS to create vector and raster layers, as well as perform spatial analysis. They combined these files with “secondary” data, including aerial photos, contour maps, and photographs to produce a database that was entirely computer-based, digital, and shareable.
Tennant and Bristow (2004) showed how GIS is particularly useful for modeling excavations at the site level for two reasons. First, accuracy and speed of survey was dramatically increased and surveyors were able to record spatial relationships simultaneously with the GPS points. Second, sharing this information (especially with the public) becomes almost effortless because the electronic format makes it easy for the researcher to circulate the information in multiple formats. Websites are a good example of how archaeologists are using GIS to create a virtual tour of an archaeological site. Interactive features like linked photos, site histories, hyperlinks, and 3D model tours enable the general public and other researchers to “visit” an archaeological site. As a public relations tool, a website could be a catalyst to encourage people to visit the site in person. The ability to transfer GIS data to a user-friendly medium like a website has enormous implications for the future of archaeology, and how archaeologists inform the public of their discoveries while simultaneously providing a means for controlling the information related to the public (Tennant and Bristow 2004). A GIS provides the ability to store archaeological features in a virtual world, creating a unique tool to assist in person-to-person dissemination of archaeological information (Neubauer 2004).
As 3D applications of GIS become more powerful and intuitive, and temporal representation becomes easier, interpreting stratigraphic context will become progressively more straightforward. New GPS units are increasingly accurate and decreasing in cost. Coupled with more powerful and affordable hardware, and more sophisticated, intuitive, and user-friendly software, archaeologists at any level are now able to computerize sites and units simultaneously with their survey (Ebert 2004; Tennant and Bristow 2004). They also have the added option of sharing this information publicly through electronic means. However, as useful as a GIS can be in recording and managing an archaeological site, it is only a tool, and can never replace the archaeologist’s need to administer a GIS database in order to interpret and analyze material culture.
References Cited
Ebert, David
2004 Applications of Archaeological GIS. Canadian Journal of Archaeology 28:319-341.
Environmental Systems Research Institute (ESRI)
2008 GIS in Archaeology. Electronic document, http://www.esri.com/industries/archaeology/index.html, accessed November 24, 2008.
Katsianis, Markos; Spyros Tsipidis; Kostas Kotsakis; Alexandra Kousoulakou
2008 A 3D Digital Workflow for Archaeological Intra-site Research Using GIS. Journal of Archaeological Science 35:655-667.
Moyes, Holley; Awe, Jaime
2000 Spatial Analysis of an Ancient Cave Site. Electronic Document, http://www.esri.com/news/arcuser/1000/cave.html, accessed November 24, 2008.
Neubauer, Wolfgang
2004 GIS in Archaeology – The Interface between Prospection and Excavation. Archaeological Prospection 11:159-166.
Tennant, Edward W., Peter Bristow
2004 Mapping Nenthorn: Taking Advantage of Emerging GPS and GIS Technologies. Archaeology in New Zealand 47(3):203-214.